The following is an article I placed on LinkedIn and was written as part of my Developing My Writing While Helping Others series.
Paul Yeatman is a microbiologist with over 15 years’ experience in documentation, validation and running investigations in TGA and FDA regulated environments. He has a strong interest in process improvement, documentation, training and developing others. From 9-5 Paul investigates and solves software problems. By night he works on his science chops. He has an arty streak, runs several blogs and enjoys communicating his experiences and knowledge in arenas such as this.
What is Data Trending and How To Identify, Action and Report Trends
USP Chapter <1116> Microbiological Evaluation of Cleanrooms and other Controlled Environments requires viable environmental data be trended and examined. Trends allow detection of drifts away from what is considered a controlled environment and can be used to tighten existing alert and action levels/limits.
A major goal of any production facility is to maintain consistency or a state of control. Another major goal is to ensure the final product is what it is meant to be, free from defects and contamination. Understanding trends is an important part of achieving this goal.
Examples outside of viable environmental monitoring are included so you get a better understanding of this topic.
What is Data?
Data, for the purposes of this discussion, is anything that can be measured and recorded. Within a microbiology monitoring program, trends are typically colony forming unit counts and Genus, species recovery levels.
What Data Can Be Trended?
Anything that can be recorded in the form of a number or that can be classified can be trended. A small selection follows:
- Incidence of a specific genus and species of microbe
- Microbe counts
- Temperatures of cleanrooms
- Out of Specification result incidence
- Corrective And Preventative Action not being completed in the required time frame
- Potency of stability samples
- Time spent on tasks
Why Trend?
By plotting data and looking at it from afar, one can see what is happening with the data. There could be a lot of noise in the data and large spikes such as those representing an out of specification result while the overall figures are steady, rising or falling. A good trend for Viable Environmental Microbiology Monitoring would be down. For an income or profit trend, seeing an upward trend is preferable. Over summer, temperatures might be seen to be higher in filling rooms than in winter. This might or might not represent a control issue. In any event, the opposite of what is desired represents an opportunity to identify and implement corrective actions.
The Two Types of Trends
Long term trends
- Initially, long term trends gathered over a minimum of 12 months are used to establish your base alert and action levels (tighter or in line with what the regulations require)
- Nothing that is observed in a long term trend should be particularly surprising to the Quality Assurance Team. Spikes will have (or they SHOULD have) been investigated, actioned and reported on at the time. An auditor examining your trends will expect this and is likely to ask for the reports.
-
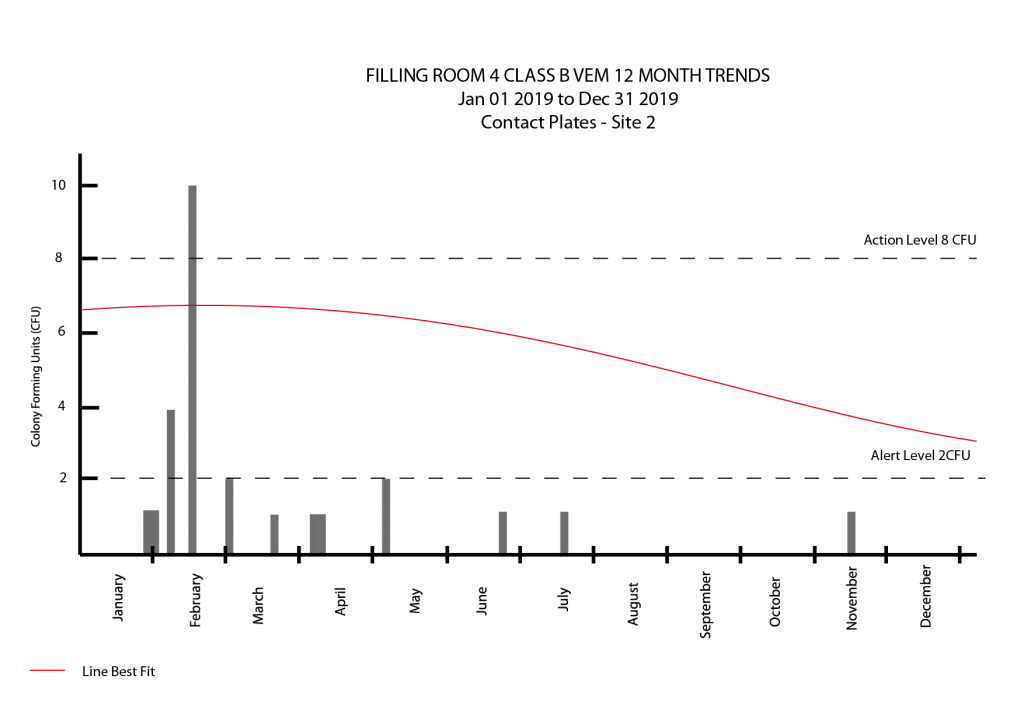
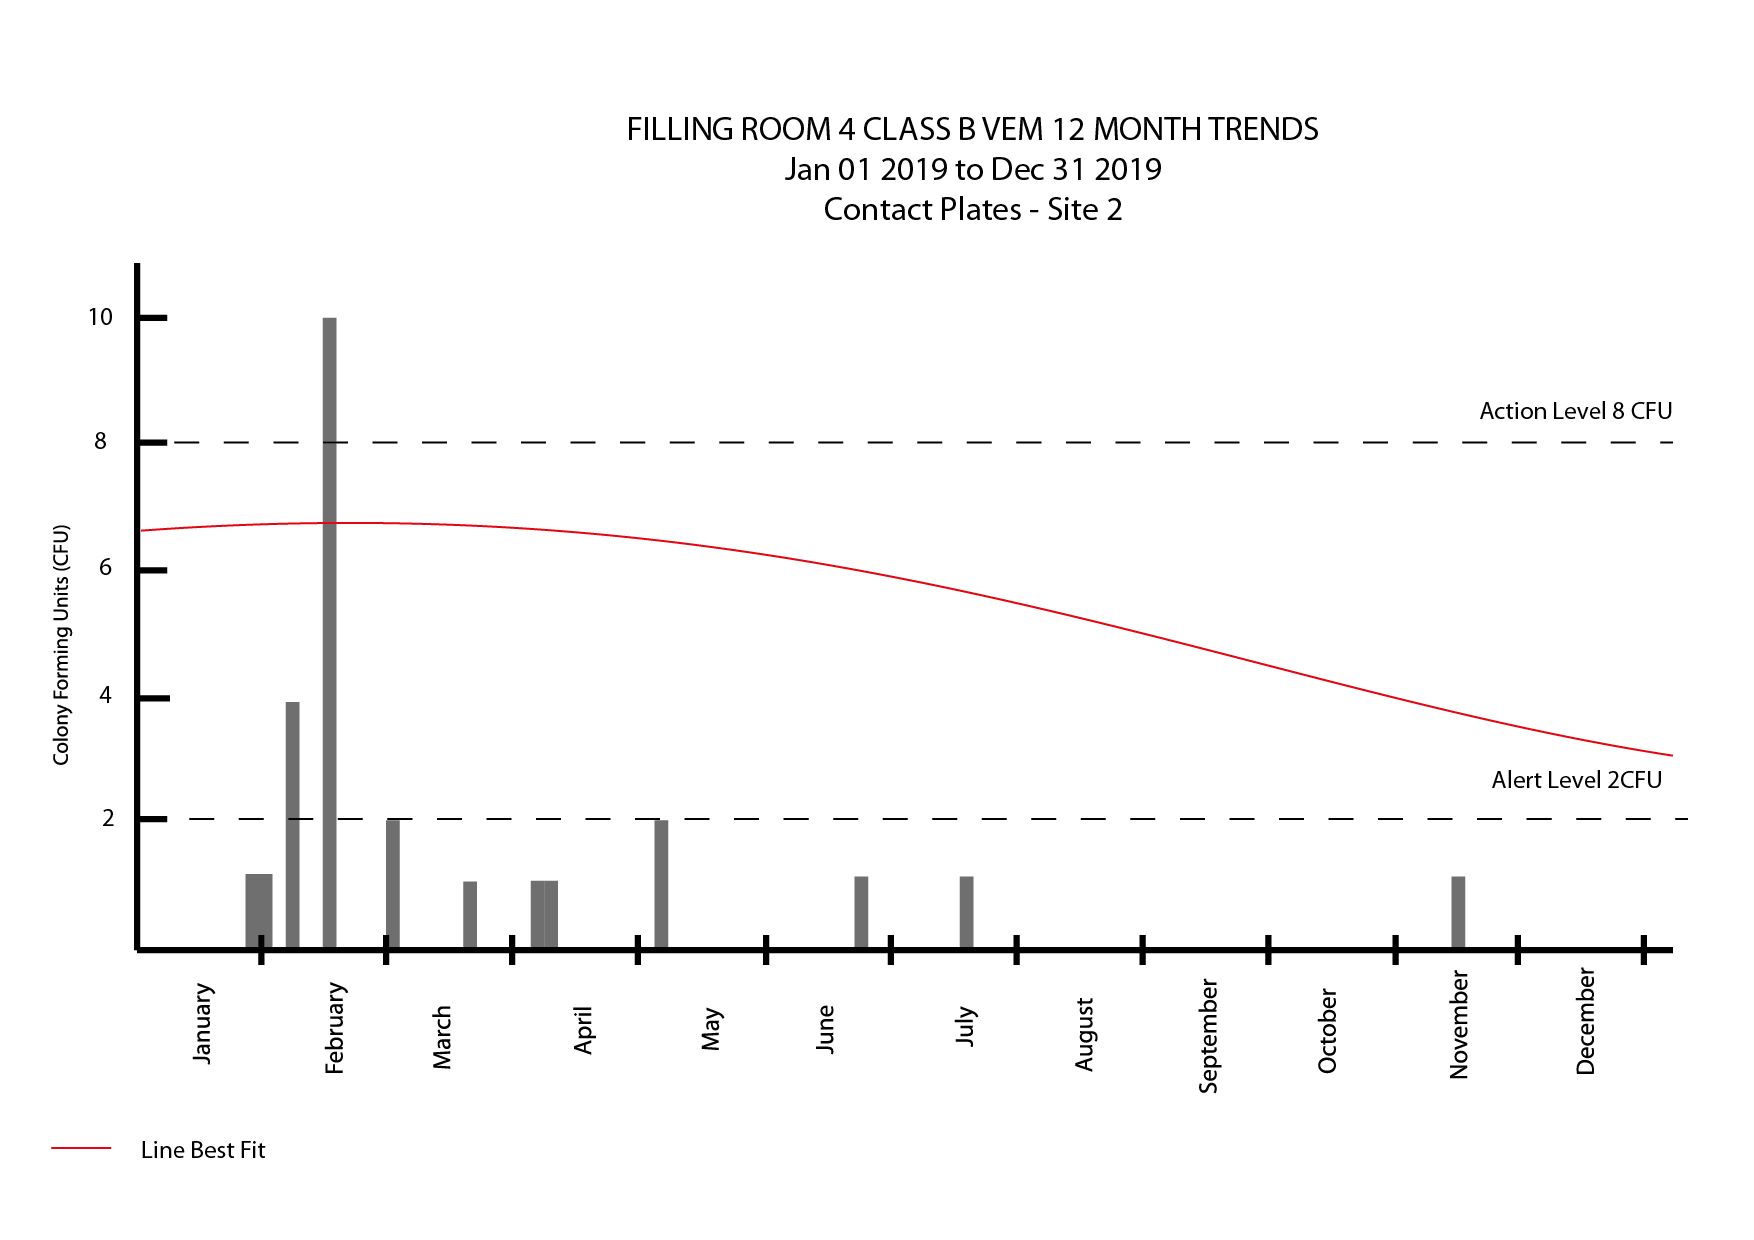
Long Term Trending Example
Adverse trends
- Short or long term trends that indicate a loss of control is near.
- Consecutive actions, always showing area in a state of alert, unwanted microbe species detected, “too many” alert level results in a small number of consecutive samples.
- A LIMS system could be set up to automatically identify an adverse trend. If using a paper and pen system, the data review stage should identify an issue if not already escalated by those recording the data.
- As for long term trends, an adverse trend needs investigation, actioning and reporting on.
-
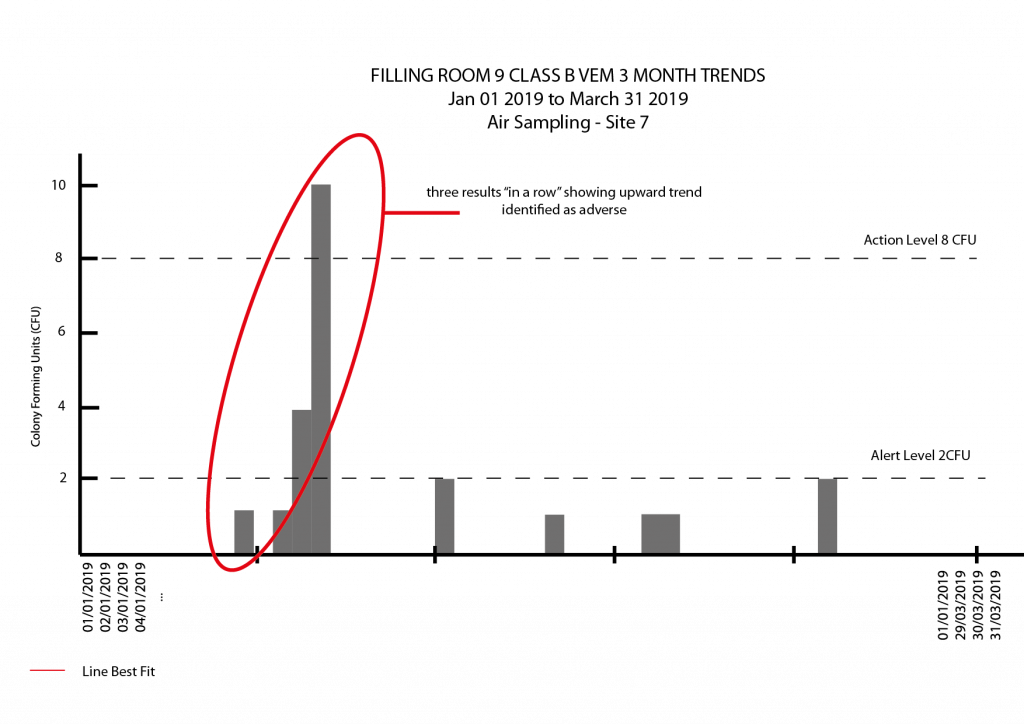
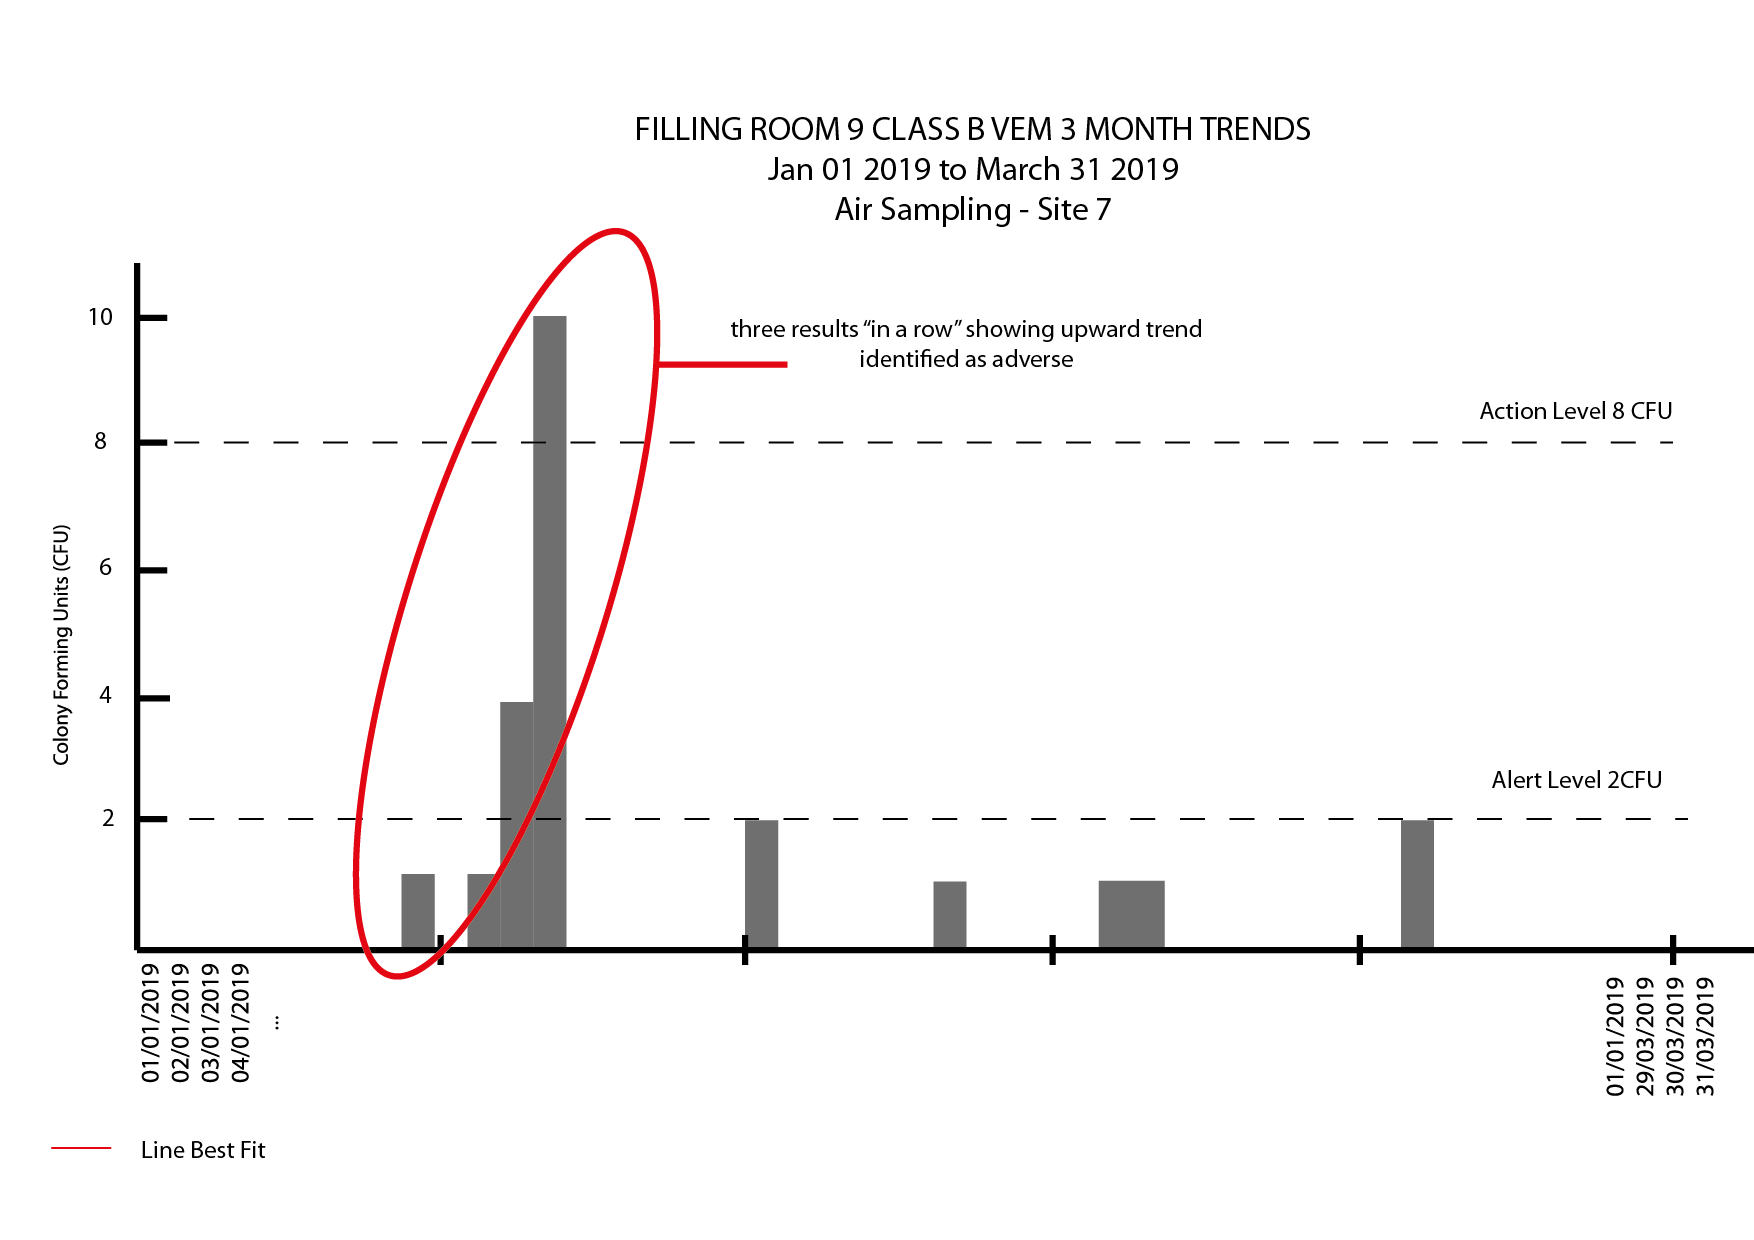
Short term trends showing an adverse trend
Long Term Trends
- A trend is a set of data that is moving (once the noise is factored out) consistently in one direction. Over the course of 12 months, where a state of control is maintained, the overall trend would be a flat line. A loss of control would see the trend go one way. Improvements in the state of control could see the trends go the other way.
- I recommend trends be reported in a graph. This saves trawling through data looking for something out of place and use of a graph allows for easy trend determination. You should also present the data in a summary table broken down into months. If management (or an auditor) desired to dig deeper, access to the raw data, such as that in a batch record could be arranged and tends to be expected.
- In the Viable Environmental Monitoring Program, a downward trend could be considered good. This trend could allow for the tightening up of alert and action limits.
- If long term trends show a potential shift towards a loss of control, things should be investigated. If corrective action can be identified, it should be implemented and the effectiveness of this determined.
- The absence of a trend might also represent a problem. If results were always within limits or zero that is seen as a red flag to an auditor as even with the best processes, operators will make errors and there will be outlier results. A history of a zero count in a clean room might also indicate a poorly validated recovery process so that would need to be checked.
Adverse Trends
- Adverse, or short term trends are those that show a marked deviation (or potential deviation) from the norm. This could be three results of increasing values in a row or even four results out of six that show movement away from what is the baseline. As these trends are short term, it is best to examine your trends on, at most every quarter as looking for adverse trends in a production facility every 12 months is a big risk. Assuming the adverse trend did not snowball into a big problem before the trends were examined, needing to investigate 12 months of batches compared to 3 is a huge difference in time, money, recalled batches (in a really bad scenario) and consumer confidence.
- A stability sample might show that efficacy is maintained for 12 months at fridge temperatures and in the 15th month present a sharp decline. If the product has a 12 month expiry, not a problem. A 36 month registered shelf life could indicate an issue with the batch. If a potency drop off was seen over three consecutive time points with the overall trend heading towards an ineffective (or unacceptable) level of API efficacy within the shelf life of the product then this would be an adverse tend.
- As part of a viable environmental monitoring program, a single alert result every once in a while can be expected. Three or more in close succession (or in the same area if sampling is rotated over shirts and batches) could indicate a shift from control and a contamination problem. The same goes for recovering the same microbe over and over again. That might represent a clean room contamination issue, a media contamination issue, a test contamination issue or something else – it is up to you to investigate and determine the cause and take steps to fix things.
- An adverse trend needs to be investigated and corrected.
For both long term and adverse trends and in accordance with the established schedules, I recommend you present the trends within a report. You will need to discuss the results, state whether they are acceptable or not and whether or not corrective action was implemented and if that was effective. You will need to reference the relevant reports. The trending report should be signed off by the head of quality and filed for quick retrieval. In the event that an adverse trend was identified, actions taken would be in accordance to established procedures. Relevant reports should be referenced in the trending summary.
Audit Considerations
Again, all adverse trends must be investigated, actioned and reported on. The Quality Assurance department, its internal auditors and third party auditors all expect this.
Your regular trending reports should point out any trends that are adverse or that represent a drift outside your state of control along with references to the reports that were written and the conclusions contained within. Out of Specification results shown in the data should also be linked to their investigative reports. Not highlighting a drift away from control or an adverse trend could be seen concealment by an auditor.
If you use a computerised system to record your data or to produce your trends, you will need to demonstrate these systems are validated and potentially provide an IQ, OQ, PQ to the auditor(s). You will also need to prove that data is unadulterated and that the figures presented are the figures originally entered into the system.
Conclusion
Anything that can be recorded can be trended. By examining trends, long term and adverse trends can be identified and corrective action taken if necessary. It is a regulatory requirement to trend your data and auditors will want to see the trends. Any “bad” trends must be investigated, actioned and reported on.
References
- USP Chapter <1116> Microbiological Evaluation of Cleanrooms and other Controlled Environments
- Title 21 CFR Part 11
- PIC/S PE009-14 GMP Guide (Part I: Basic Requirements for Medicinal Products) 2018
Did you find this informative or useful? Please consider a small donation so I can expand and improve on what I deliver.
![]()