IMM3022 Immunocytochemical and Lectin Labelling of Acid Secreting Cells in the Stomach and Kidney
Paul Yeatman
Partner/s: Rachael Davies, Tanya De Jong, Annaliese Sampey, Adreana Lambrinakos, Anna Rentoulis, Steve Argirio, Spiros Foscolos.
Date: 24th August -> 5th October 1994.
Introduction
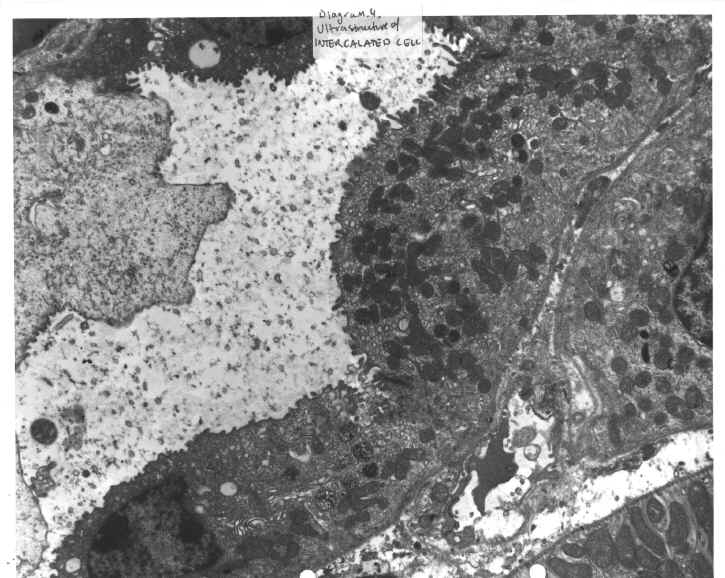
Certain organs in the body contain cells, which are involved in acid secretion. In the stomach such cells are called parietal cells and exist in gastric pits contained in the stomach body. (Diagram.1 and Diagram.2). In the kidney such cells are known as intercalated cells, and line the collecting ducts of the kidney. (Diagram.3 and Diagram.4) In both cases, a two-subunit ATP dependent (ATPase) proton pump controls the acid secretion.
In order to stain tissues, they were obtained from mice of various ages. The mice were killed and their stomachs and kidneys removed while still fresh. The tissues were then fixed for at least one hour at room temperature with par-formaldehyde. The samples were then dehydrated, embedded in paraffin wax and sectioned in readiness for the various labelling techniques.
For transmission electron microscopy, the tissues were fixed in glutaraldehyde at 4°c before being coated with metal after sectioning.
The monoclonal antibody 1H9 is used to stain the alpha subunit of the H-K ATPase.
The monoclonal antibody 2B6 is used to stain the beta subunit of the H-K ATPase.
The monoclonal antibody ET-1 is used as an isotype control.
Biotinlated goat anti-mouse immunoglobulin was used to label the alpha subunit of the ATPase proton pump.
Rabbit anti Na-K ATPase polyclonal antibody (603) is used to detect principal cells in the kidney.
TRITC tomato lectin, FITC tomato lectin and FITC potato lectin are used to detect the H-K ATPase pump.
Biotinlated peanut lectin is used to label the intercalated cells in the kidney.
Immunofluorescence or peroxidase staining was used to detect tissue labelling. Rhoadeamine and streptavidin were used to produce fluorescence.
Line 69 mice were examined at various ages for the expression of the transgene displayed in Diagram.12
Transgenic material was provided from the tail of the transgenic mice and the following PCR protocol run.
1/94°c 5min, 55°c 90sec; 72°c 3min x1
2/94°c 1min; 55°c 90sec; 72c>c 3min x30
3/94°c 5min; 55°c 90sec; 72°c 10min x1
Aims
- To detect acid secreting cells in the mucosa of the stomach and outer medulla and cortex of the kidney.
- To examine the ontogeny of the kidney.
- To examine the cell types expressing a trangenetic element Associated with acid secretion in kidney cells.
- To compare staining techniques in relation to the experimental aims.
DIAGRAM 1: Stomach And Location Of Gastric Pits
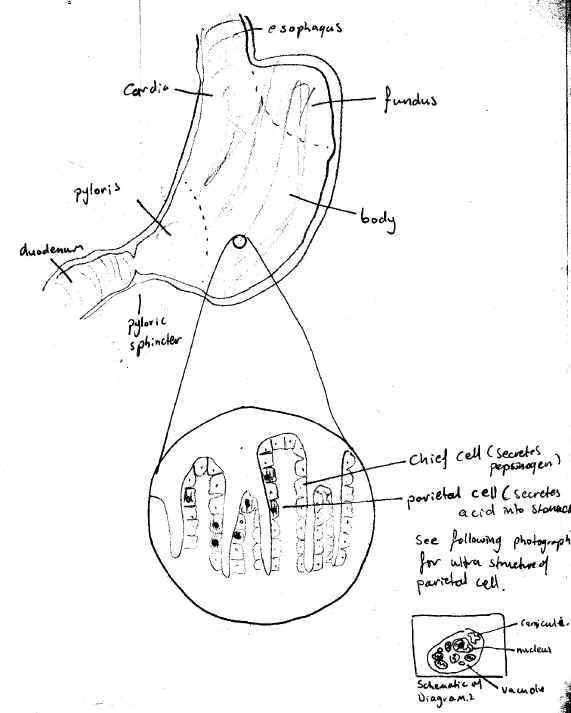
DIAGRAM 2: Ultrastructure Of The Parietal Cell
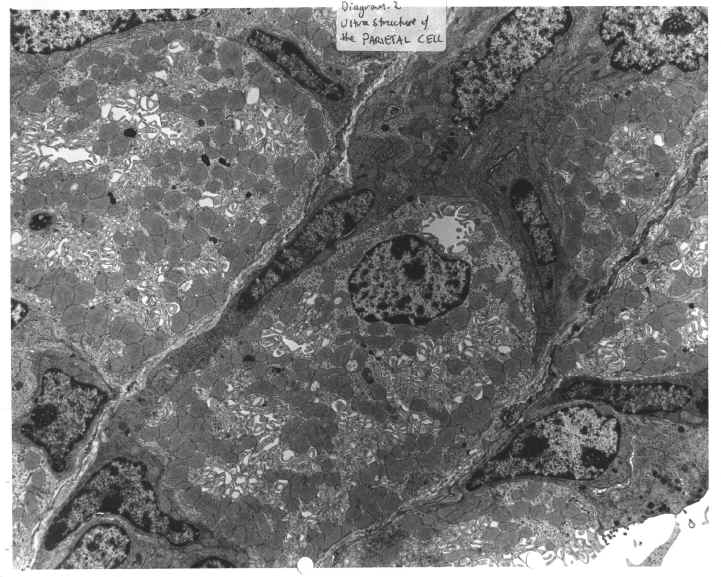
DIAGRAM 3: Kidney And Location Of Collecting Ducts

DIAGRAM 4: Ultrastructure Of The Intercalated Cell
Results
Table.1 Expression of Transgene Results
| Mouse number | X-gal staining | PCR result |
| 13961397
1400 1410 |
positive (+)negative (-)
– + |
+-
– + |
NOTE 1: Only photographs yielding the best demonstrative results were included in the result section.
NOTE 2: Diagram. 5 and 6 are a double-labelled set.
DIAGRAM 5
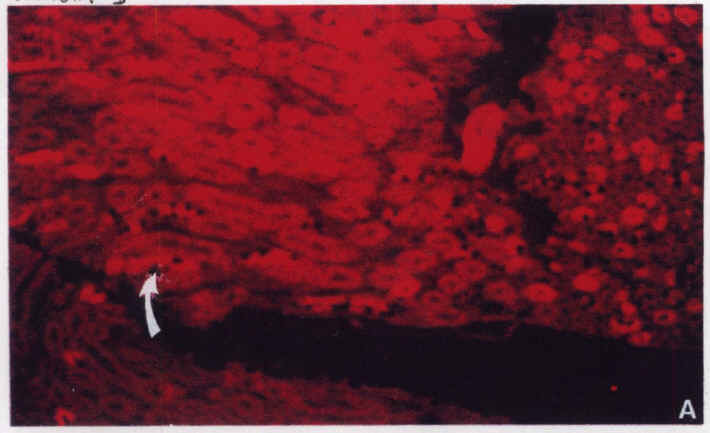
Diagram.5: Tgz kidney stained with biotinlated peanut lectin/FITC – Arrow shows site of transgene expression.
DIAGRAM 6
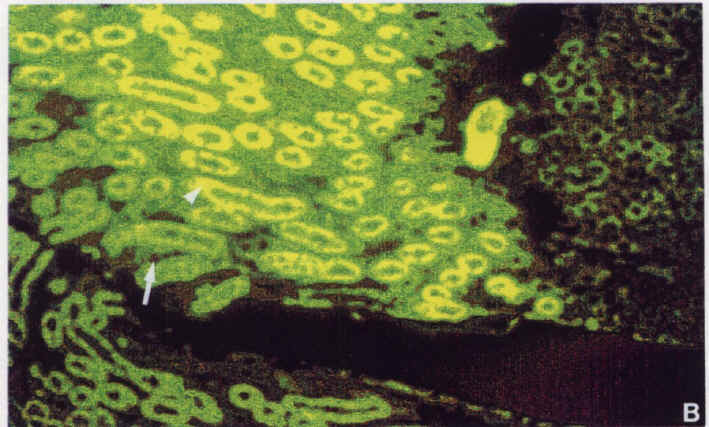
Diagram.6: Tg2 kidney stained with Antibody 603. Large arrow shows site of transgene expression. Small arrow shows Na-K ATPase (principal cell).
DIAGRAM 7

Diagram.7: Adult kidney (x10) stained with tomato lectin/immunoperoxidase.
DIAGRAM 8
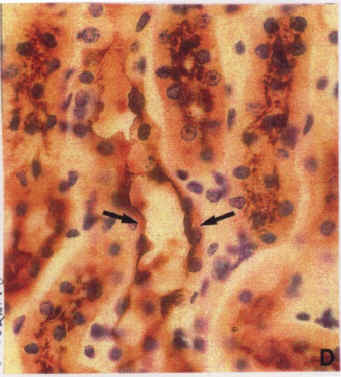
Diagram.8: Adult kidney stained with tomato lectin/immunoperoxidase. Arrows show apical surface binding as well as basolateral staining.
DIAGRAM 9
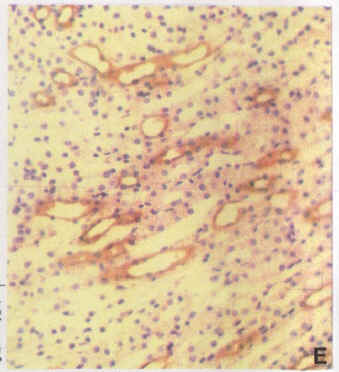
Diagram.9: Adult kidney (x25) stained with biotinlated peanut lectin/immunoperoxidase.
DIAGRAM 10
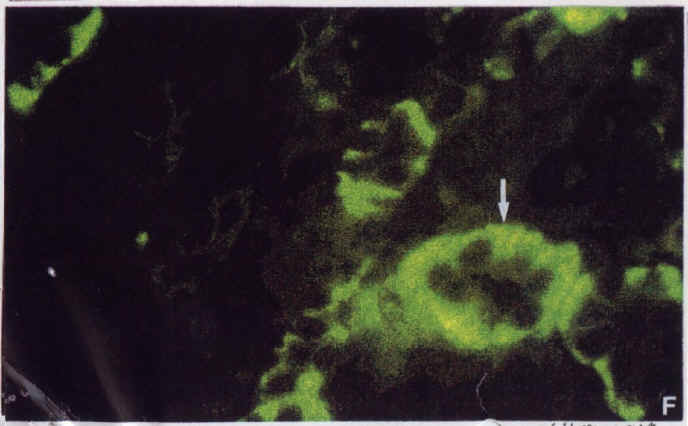
Diagram.10: 10-day-old kidney stained with antibody 603/FITC. Arrow shows principal cell staining.
DIAGRAM 11
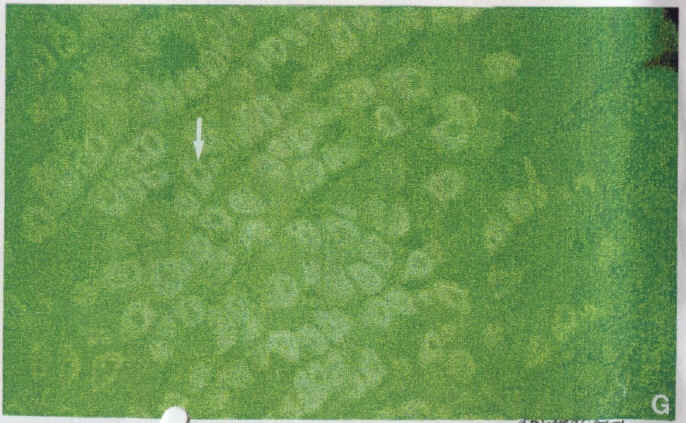
Diagram.11: Adult stomach (x20) stained with 1H9/FITC. Arrow shows the alpha sub unit of the gastric proton pump in parietal cells.
DIAGRAM 12
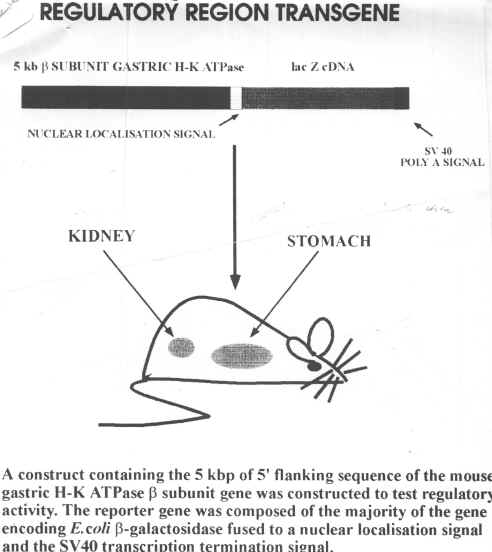
DIAGRAM 13
Discussion
Ontogeny of Acid Secreting Cells
The kidney stained from a one-day-old mouse showed apical and basolateral staining within the same cells. In fully differentiated cells, either- the apical surface or the basolateral cell surface will stain, but not both when the correct label is used). By day 10, some cells show only basolateral staining, others show only apical staining, while others show both forms of staining. This suggests that by this time, some of the kidney cells have differentiated into either principal cell of intercalated cells. By the time adulthood is reached, cells of the kidney will either stain apically of basolaterally, but not both. This is shown in Diagram.7 to Diagram.9. In Diagram.7, basolateral staining can be easily observed in the medulla but not papilla of the kidney. This staining is due to tomato lectin binding to both forms of the ion pumps within kidney cells. This is best shown in Diagram.8 where basolateral and apical staining can be seen quite clearly within the same cell. Diagram.9 shows apical staining in intercalated cells due to peanut lectin.
Diagram.10 shows a 10-day-old kidney section that has been stained with the polyclonal antibody 603. This antibody is used to detect principal cells. Here, one can see that the staining is basolateral, as would be expected for a principal cell. However, one can also make out a small amount of apical staining in some isolated cells, which supports the earlier view that full differentiation has not yet occurred.
Diagram.11 was included to show a tissue section of adult stomach. In this diagram, one may observe the labelling of the gastric pump’s alpha subunit within a parietal cell. This basically shows that an acid secreting cell was observed within the stomach.
Transgenic Expression
The transgene inserted into the mice contains the code for the beta sub unit of the gastric H-K ATPase. A lac Z marker gene was included in the insert to enable easy detection of the transgene by use of X-gal, which turns blue in the presence of beta galactosidase. Thus cells in which the transgene is being expressed will be blue. One can see that in Diagram.5, the transgene is expressed in intercalated cells (as labelled with peanut lectin). Diagram.6 is the same section as Diagram.5 but labelled with the 603 antibody. Thus the yellow cells are principal cells. By comparing these two slides, one can see that the transgene is expressed in intercalated cells (that is cells which contain the H-K ATPase), while the gene is not present in principal cells (meaning those which contain the Na-K ATPase. Tissues of various ages show that in the kidney, the number of such cells remain constant, while in the stomach, the H-K ATPase cells appear to decrease as the mouse ages.
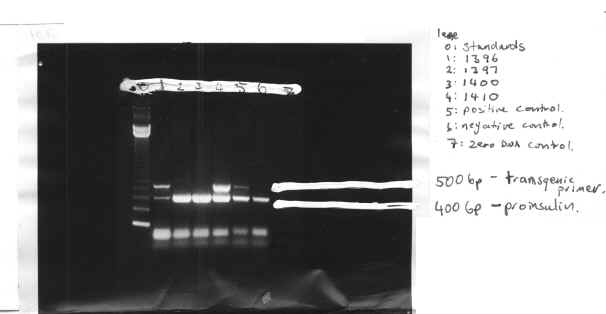
The presence of the 500-bp protein band indicates the transgene. This is due to this band being the transgenic primer. During the PCR reaction, the primer is amplified so it becomes visible in a protein separation. The negative transgenic mice show no such band. The 400-bp band indicates that DNA was in fact present so if the transgenic sequence were present it would have been amplified. The transgene is expressed in 50% of mice offspring, as shown by our PCR, with mice 1396 and 1410 being positive and mice 1397 and 1400 being negative. The positive mice were further investigated to ascertain which cells the transgene was being expressed in.
Conclusions
1/Acid secreting cells were found to be present in The stomach (parietal cells) and in the kidney (intercalated cells).
2/ The day 1 results suggest that principal cells and intercalated cells are not fully differentiated at this stage as shown by basolateral and apical staining within the same cells (normally Ab 603 stains the Na-K ATPase in the basolateral surface of principal cells, while peanut lectin stains the apical surface of intercalated cells.
In the adult kidney, the results suggest that full differentiation has occurred between the principal and intercalated cells. Apical staining of the intercalated cells with peanut lectin, and basolateral staining of the principal cells show this by the antibody 603.
3/ the results suggest that Tg expression occurs in cells containing the gastric hydrogen potassium ATPase. Intercalated cells staining with X-gal show this, while principal cells (which express the sodium potassium pump) did not show x-gal staining.
4/ Immunoperoxidase staining is best used where one wishes to observe tissue and cell morphology. Immunofluorescence is best used in double labelling processes as it allows for easy comparison of the tissue labels.
References
Human Physiology 2nd edition: Rhodes and Pflanzer (1992) pp 197,826.