
A brief history of the antibiotic assay
The quantitative use of zones of agar made inhibitory to the growth of one microorganisms by diffusing substances produced by another organism was in use at least as early as 1885 (Analytical Microbiology, Kavanagh, 1963). The first official assays of penicillin were carried out in 1943. Publication of the theoretical aspects involved was published by Cooper and Woodman in 1946 in Pathological Bacteriology. The antibiotic assay used by pharmaceutical companies is primarily the agar plate diffusion assay. Some products that are a mixture of polymers may have a specific monograph stating that they must be assayed by a turbidimetric method. Such an example is Gramicidin.
Why do manufacturers conduct antibiotic assays?
Each product made containing antibiotics has a label that states the potency of the antibiotic it contains. A manufacturer needs to prove that the drugs contain what they are said to contain. Products that do not match the labelled claims are said to be adulterated (and are not fit for sale). To ensure that the label claim is correct, the antibiotic potency of products are tested and the result recorded. This ensures that what is sold has the expected potency and thus does what it is meant to do (i.e. the customer gets a quality product).
Why are statistics used to produce a result?
To improve the accuracy of the assay result, multiple samples are prepared and tested. These are then plotted on a curve and the test sample results are compared to the standard preparation results. If the results are plotted on a graph, why would a manufacturer also perform a statistical evaluation of the data?
- The statistical analysis is used to determine if the data an assay yields makes sense mathematically.
- Is the test sample curve parallel to the standard curve?
- Do the groups of data all fit in groups or is the data random (i.e. is there a normal distribution)?
- Is the data grouped enough to meet stated correlation levels? Eg <4.05 for a stated antibiotic product class.
What do the statistics mean?
The various statistical analysis you will see on a standard spreadsheet include:
Shapiro-Wilk Normality Check (<1.96 = ok):
In statistics, the Shapiro-Wilk test tests the null hypothesis that a sample x1, … xn came from a normally distributed population. It was published in 1965 by Samuel Shapiro and Martin Wilk.
Error Mean Square:
Measures the average of the square of the “error.” The error is the amount by which the estimator differs from the quantity to be estimated. The difference occurs because of randomness or because the estimator doesn’t account for information that could produce a more accurate estimate.
UFL and LFL figures:
These are certainty bars on the data. These limits of uncertainty may be decrease by increasing the number of assays of a product.
Bartlett Test (homogeneity of variation within treatment groups):
Bartlett’s test is used to test if k samples have equal variances. Some statistical tests, for example the analysis of variance, assume that variances are equal across groups or samples. The Bartlett test can be used to verify that assumption. Bartlett’s test is sensitive to departures from normality. That is, if your samples come from non-normal distributions, then Bartlett’s test may simply be testing for non-normality.
Correlation:
Used during the turbidimetric assay to determine if the slope of the test samples is parallel to the slope of the standard samples. It is the cosine of the angle between the two vectors of samples.
Mean:
Equates to the average of all the data with any non normal data excluded from the calculation.
Eg. Out of 10 values, 1, 1, 1, 5, 1, 1, 1, 1, 1, 1, the 5 would be excluded as it would be considered to be statistically out-of-place.
Student’s t statistic:
The Student’s t-distribution (or also t-distribution), in probability and statistics, is a probability distribution that arises in the problem of estimating the mean of a normally distributed population when the sample size is small. It is the basis of the popular Student’s t-tests for the statistical significance of the difference between two sample means, and for confidence intervals for the difference between two population means.
What is a Latin square?
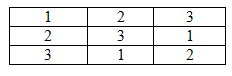
A Latin Square is a n x n table filled with n symbols where the symbols do not repeat down each row or column, but are present in each row and column.
An example of a Latin square from every day life is the sodoku puzzle. Below is a simple Latin square:
Why are they used?
Latin Squares can be used in an error correction capacity where the data is noisy. This enables the data that shows variability to be smoothed. Due to the nature of antibiotic assays, variability or noise is introduced through:
- Uneven agar thickness
- Differences in culture concentration across plate
- Minor differences in diffusion rates
- Minor differences in recording of diffusion zones.
- Minor differences in the amount of antibiotic soaked into the test discs.
By using two or more Latin Squares, the noise can be reduced.
Latin Squares are also used to randomise the placement of discs, wells or cylinders containing the test samples. The aim of this is to reduce operator bias that may be introduced if the tester knows which samples contain the standards and test samples and the concentrations of antibiotic in each.
How is a standard used to produce a result from a test sample?
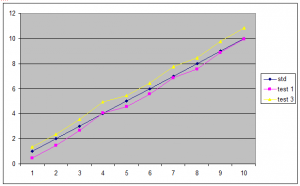
As discussed, the test samples are plotted on a graph along with at least two concentrations of standard. When the two sets of lines are parallel, the test sample concentration can be read directly from the graph by comparing the sample to the standard.
Eg,
Assay Trouble Shooting
What might make an assay fail or be invalid.
Anything that would give a non normal distribution of data or result in a non parallel standard vs sample curve:
- Unexpected microbial activity
- Poor weighing
- Poor diluting
- Uneven agar pouring
- Uneven mixing of culture
- Lots more or less antibiotic than expected may greatly alter the dose response curve
- Changes to assay media
Appendix:
- Microbiological Assay for Pharmaceutical Analysis – A Rational Approach, William Hewitt ISBN 0-8493-1824-6
Did you find this informative or useful? Please consider a small donation so I can expand and improve on what I deliver.
![]()